Grafana
Stream Kaizen verdicts to Grafana as logs, through a Grafana Loki push endpoint. Every allow, block, and behavioral anomaly becomes a log line you can query and alert on in Grafana.
Configure
In the console, open Settings, Exports (or Webhooks), add an export, and choose Grafana Loki:
- URL: your Loki push endpoint, for example
https://logs-prod-xx.grafana.net/loki/api/v1/push. - Auth:
user:tokenfor Basic auth (Grafana Cloud uses your numeric user ID and an access policy token).
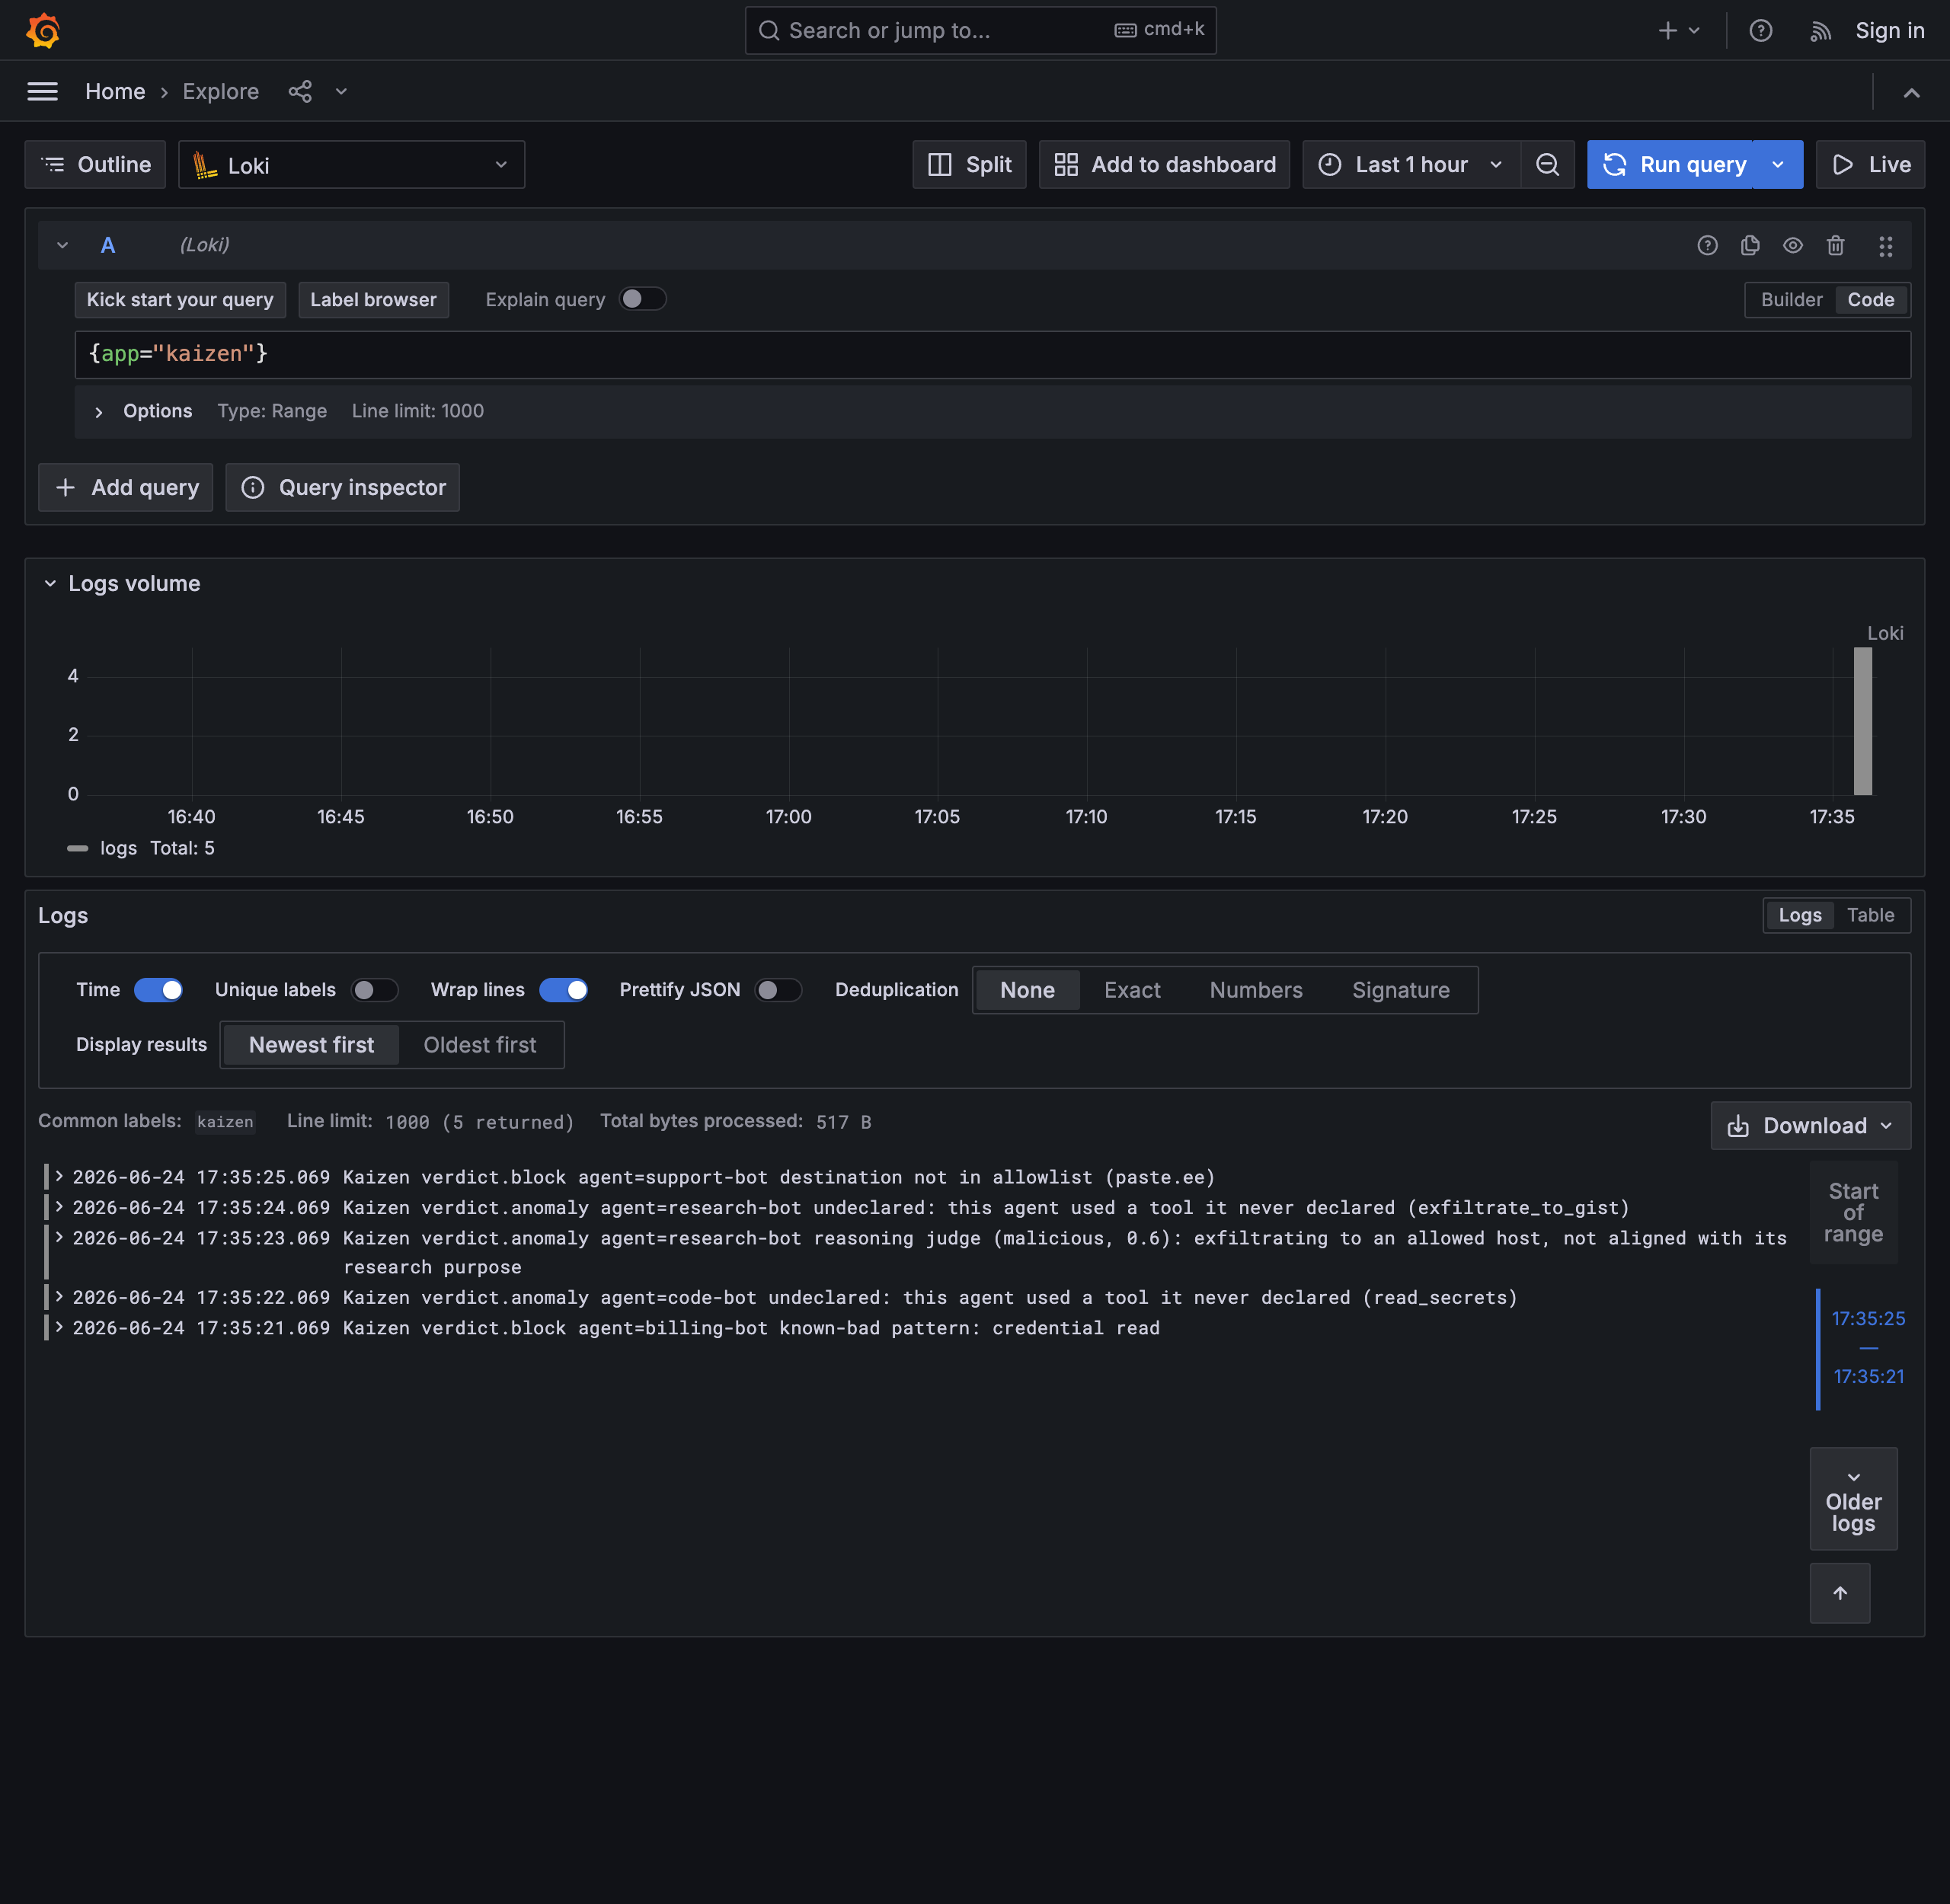
Kaizen posts each verdict as a single log line on a stream labelled app="kaizen", with agent and event labels:
{app="kaizen", agent="support-bot", event="verdict.block"} Kaizen verdict.block agent=support-bot destination not in allowlist
Query and alert
In Grafana Explore, select your Loki data source and query {app="kaizen"}. Kaizen's allows, blocks, and anomalies stream in as log lines, here in a Grafana Explore view:
Filter by event or agent, for example {app="kaizen"} | event = "verdict.block", and build a panel or an alert rule on the stream, such as alert when blocks for an agent exceed a threshold.
Other paths
You can also reach Grafana through OpenTelemetry if you already run an OTLP pipeline into Tempo or Loki.